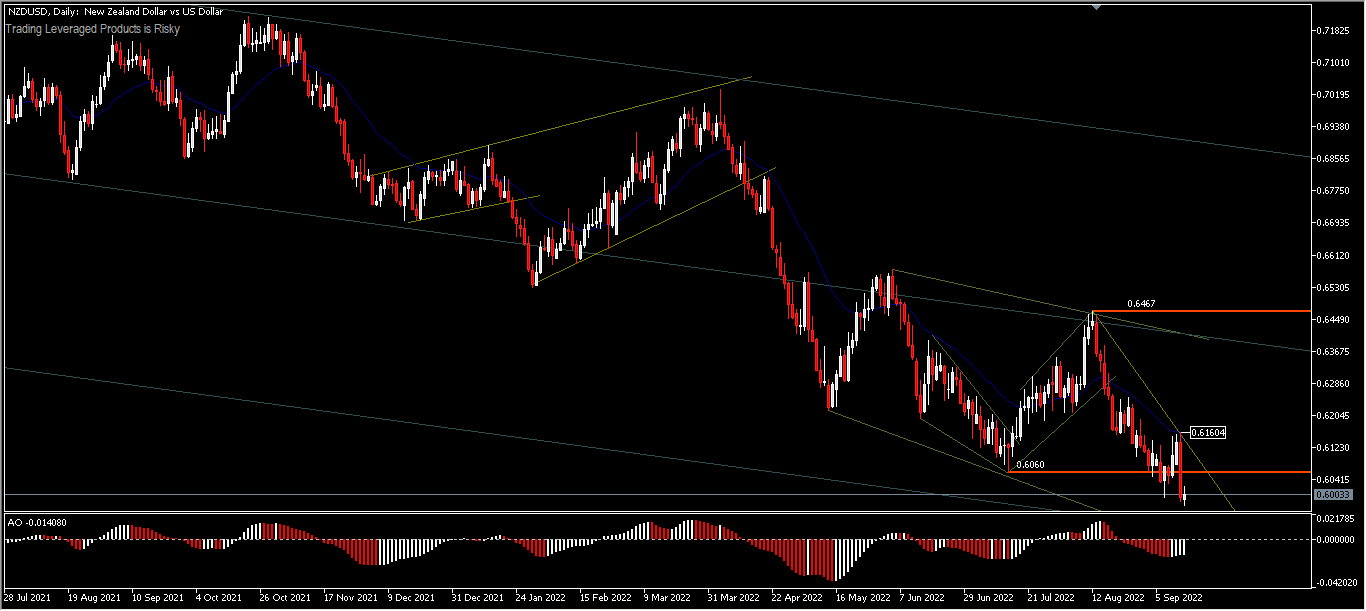
The NZD to USD exchange rate has been in a strong bearish trend in recent weeks. This decline has occurred in line with the continued risk-off sentiment in the market alongside the continued tightening of the Fed. Officials have signaled that the bank will continue to raise rates this year in a bid to bring down soaring inflation.
The Fed’s further rate hike signal is getting clearer, after the US inflation data. These figures revealed that the country’s inflation is rising at a faster pace than expected. The headline CPI rose by 8.3% in August, while the core CPI jumped by 6.3%.
The NZDUSD pair fell after the Q2 current account data from New Zealand. The figures show that the current account rose by more than N$5.22 billion in the second quarter. The current account as a percentage of GDP was -7.7%, worse than the expected -7.40%. The latest major catalyst was the New Zealand GDP data earlier today. The forecast was for the economy to expand by 1.0% in Q2 on an annualized basis and 0.2% on a quarterly basis. The actual data was significantly better with the Annualized number coming in at 1.7% and the quarterly figure registering a 0.4% lift.
This has added to the market optimism that the economy will continue to bounce back further into positive territory. The trade balance surplus was largely in the second quarter, although business confidence was depressed before switching back to deficit in June, while Q2 labor costs nearly doubled from the previous quarter, as the unemployment rate remained at a record low.
The lifting of travel restrictions in May brought some economic relief, which may be more evident in the release of Q3 GDP. The strong Q2 figures today, however, will come significantly into play when the RBNZ meets on 5 October to set policy.
Technical Analysis
NZDUSD continued its weakness for the 5th week and broke through the 0.6060 support structure for the second time. The bias remains to the downside, with chances to test 0.5950 support, the May 2020 low. The move remains below the 26-day EMA average with oscillations to the sell side. However, a move above the resistance at 0.6160 will confuse the outlook. Broadly speaking, the bears’ dominance does not seem to be running out of steam, as long as the price moves below the median line.

In the H1 period, Wednesday’s trading looked quiet and only moved between 0.5975 and 0.6024. A move above 0.6024 could test 0.6060 while a move below 0.5975 support would only confirm a continuation of the bearish trend.

Click here to access our Economic Calendar
Ady Phangestu
Market Analyst – HF Educational Office – Indonesia
Disclaimer: This material is provided as a general marketing communication for information purposes only and does not constitute an independent investment research. Nothing in this communication contains, or should be considered as containing, an investment advice or an investment recommendation or a solicitation for the purpose of buying or selling of any financial instrument. All information provided is gathered from reputable sources and any information containing an indication of past performance is not a guarantee or reliable indicator of future performance. Users acknowledge that any investment in Leveraged Products is characterized by a certain degree of uncertainty and that any investment of this nature involves a high level of risk for which the users are solely responsible and liable. We assume no liability for any loss arising from any investment made based on the information provided in this communication. This communication must not be reproduced or further distributed without our prior written permission.
