US Dollar Index
The dollar index rose , to 106.85 , and it is still below the level of 107.27, the previous resistance on 27-7-2022 , this resistance area was tested ten times before.
The dollar index is trading above the 50 arithmetic average, and the average is above the 200 average, on the hourly time frame. The RSI is at the level of 56, above 50, and below the overbought 70, and the stochastic indicator is at 79 and is heading down.
The long-range MACD indicates bullish momentum, the indicator is above zero, but is heading downwards, which indicates the possibility of a reversal and a downward movement soon.

Euro Dollar
The euro dollar fell , affected by the strong rise in the dollar index, it reached the 1.0121 support , and this support was tested three times before, the fiber is testing the 50-hour average now, and if it breaks and stabilizes above, it will open the way for 1.0363 levels, the previous resistance on August 11, 2022.
 Pound Dollar = Cable
GBPUSD (Cable) remains under pressure, breaking the 50 hour average, and trading below the 200 hour average as well. The long term MACD is indicating bearish momentum, but the STOCK and RSI are indicating a possible reversal is near.
The Pound is close to testing the 50-hour average, in the event of a breach and stability above, it opens the way to test the 1.2274 level , which is the previous resistance on August 10, 2022.
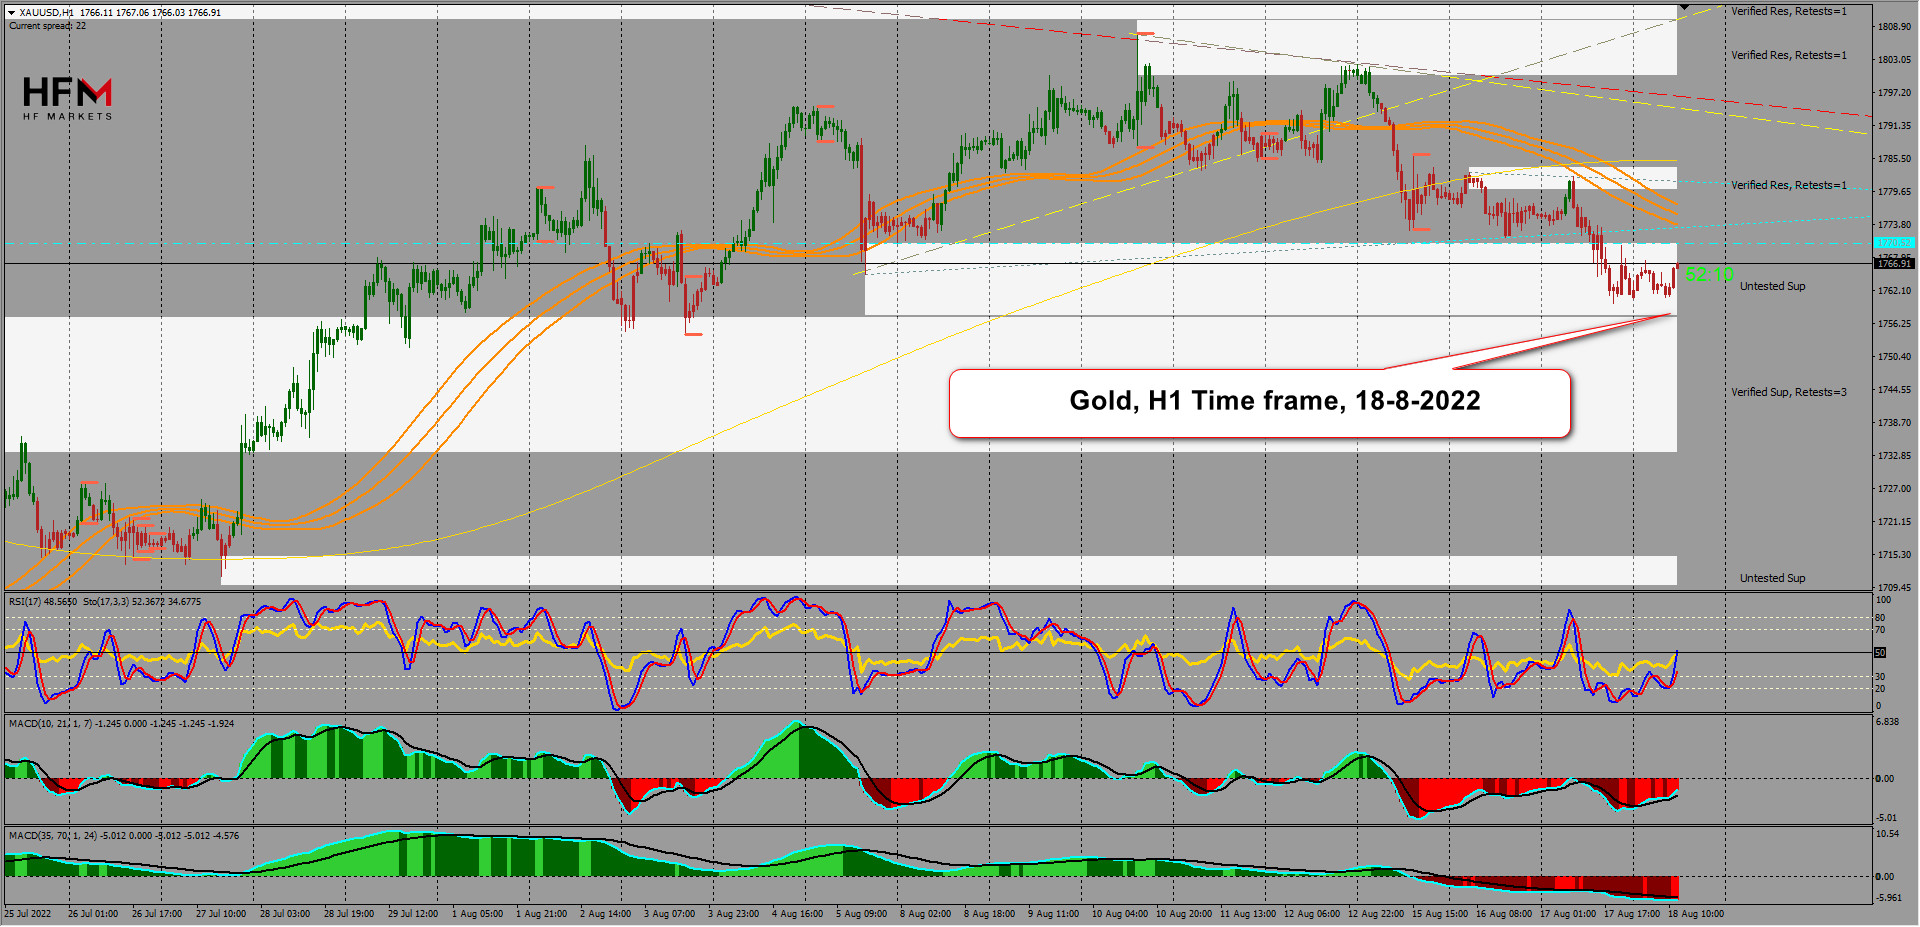
Gold tested the 1800 level , consolidating its gains with the inflation report issued by the United States and it was better than expected and may have indicated that inflation had reached its peak and began to decline, the dollar fell after the report and gold benefited from this decline by achieving gains to test 1800 .
The impact of the report quickly wore off, with recession fears from China, the People’s Bank of China cutting rates by 10 basis points, investors rushing to the dollar, and gold falling again to 1759. Support dated August 3, 2022.
Technically: Gold is trading below the 50 hour arithmetic average, and below 200 hours as well. The next support is 1750 and then 1730 . In the event that traders decide to bet on the rise of gold and break through the 50-hour average, and settle above, the next levels are 1800 and then 1830 resistance on June 27, 2022.

USOil Markets
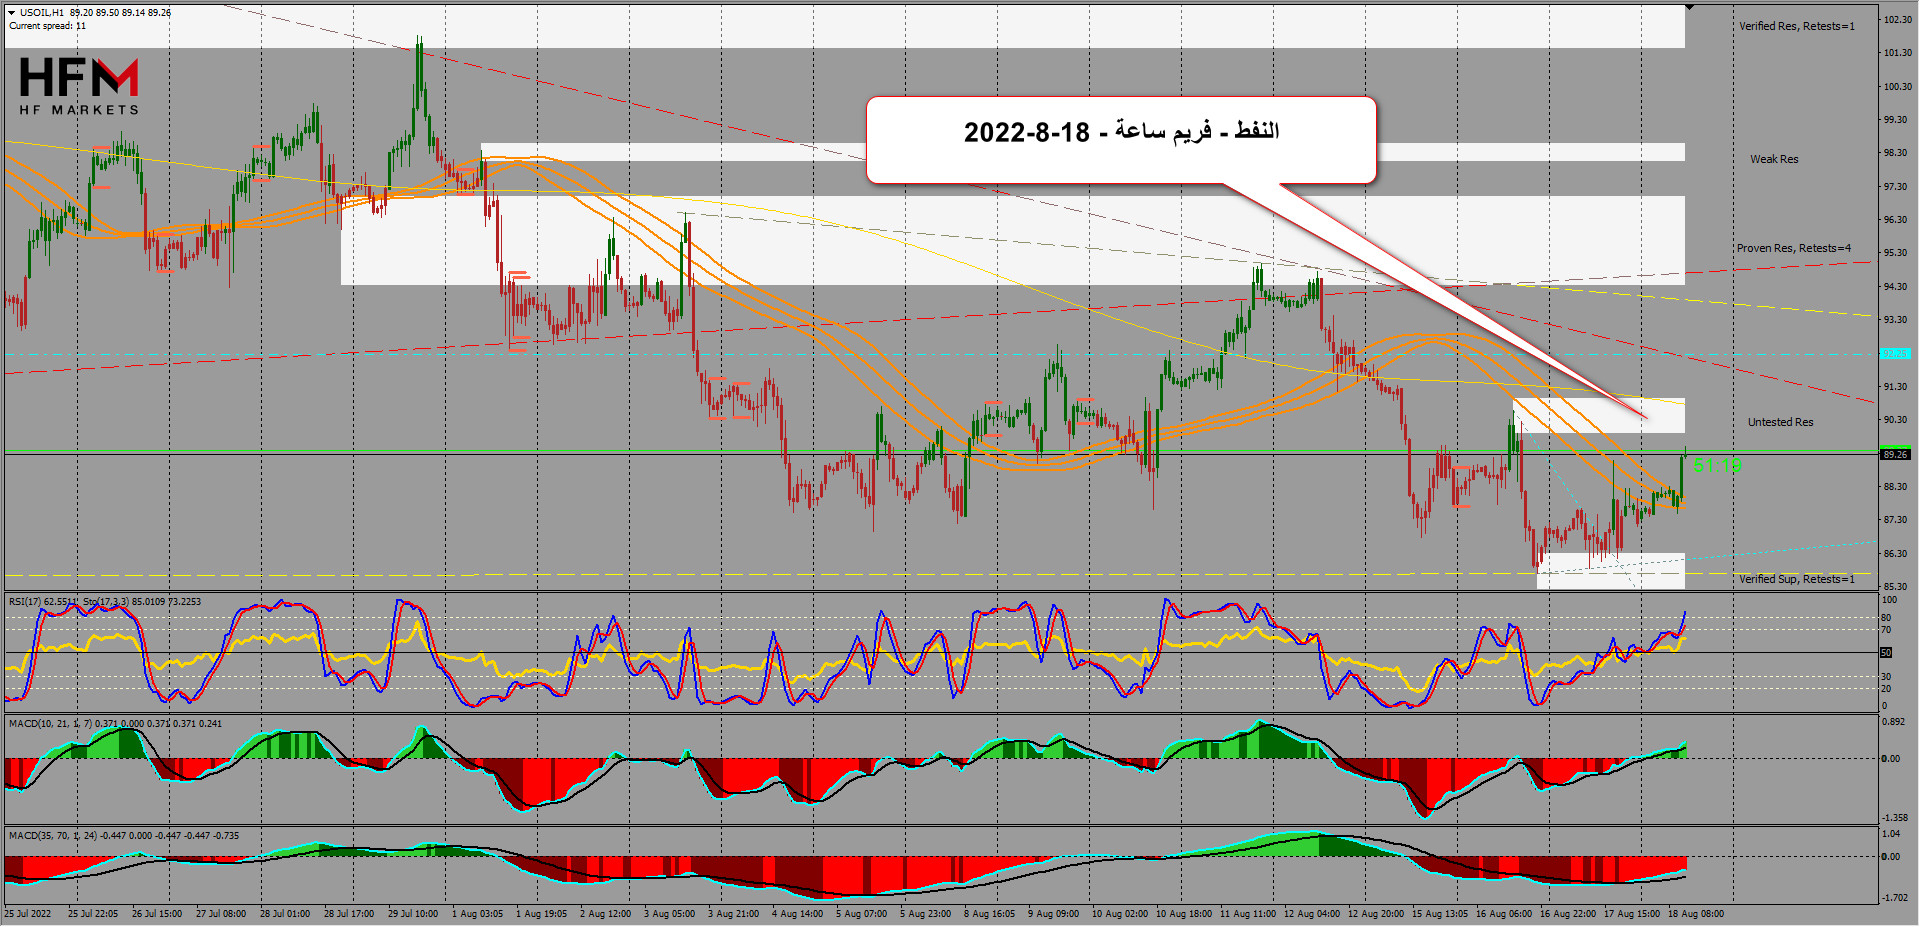
USOil fell, under fears of lack of demand, and optimism for an Iranian-US nuclear agreement, oil is now trading at 88.88 dollars a barrel, above the 50-hour average, but below the 200-hour average. The general trend remains bearish, and the next levels for support are $85 a barrel, then $80, a support area from January 21, 2022.
 Dow Jones = Dow Jones 30 Industrial Index
The Dow Jones (US30) index reached its peak near the level of 37,000 January 5, 2022, and fell to the lowest level of 29,680 June 17, 2022, and it has been reaping gains, breaking through resistance, and settling above the support since then, supported by the imminent end of the Fed’s tightening package and the strong profits that have been announced from some of the key companies in the Index.
It is clear that the bullish momentum continues technically, the index is currently trading at 33985 , and is heading up, the index is breaking the 50 hour SMA now, and the 200 hour index is settling above, the long-term MACD indicates bullish momentum, although it shows the momentum is heading down, but this can be considered a correction to complete upward path.
Click here to access our Economic Calendar
Islam Salman
Market Analyst – Middle East
Disclaimer: This material is provided as a general marketing communication for information purposes only and does not constitute an independent investment research. Nothing in this communication contains, or should be considered as containing, an investment advice or an investment recommendation or a solicitation for the purpose of buying or selling of any financial instrument. All information provided is gathered from reputable sources and any information containing an indication of past performance is not a guarantee or reliable indicator of future performance. Users acknowledge that any investment in Leveraged Products is characterized by a certain degree of uncertainty and that any investment of this nature involves a high level of risk for which the users are solely responsible and liable. We assume no liability for any loss arising from any investment made based on the information provided in this communication. This communication must not be reproduced or further distributed without our prior written permission.


