Support and Resistance is an integral concept in technical analysis trading. This is one of the most basic concepts that traders have to learn in order to be effective in technical analysis. But what is it really and how should we approach trading around these levels?
What is a Support and Resistance?
Support and Resistance levels are levels on the price chart which traders see as a psychological barrier.
Support refers to a level which tend to hold price above it, thus it is called support. For example, the market may see the 0.8700 level on the EUR/GBP as a support level. This means that price tends to stay above this level, bouncing off it whenever it drops around the area of this support level.
Resistance on the other hand is the exact opposite. It is a level which price tends to resist going above it, bouncing back down whenever it touches this level, thus it is called a resistance. For example, on the same chart, the market may be seeing the 0.8750 level as the resistance, then price would tend to bounce back down whenever it reaches this level.
Supports and Resistances are, as mentioned earlier, psychological barriers. This is because traders believe price should not breach these levels. In the case of a support level, price should not drop below it because traders see the price range above it as the fair price. Price dropping below it means that this level is too cheap.
In the case of a resistance level, price should not breach above it because the market sees the price range below it as the fair price range. Price breaching above it would be considered too high and sellers would quickly jump in on any opportunity to sell if price is above it.
Trendlines as Support and Resistance Levels
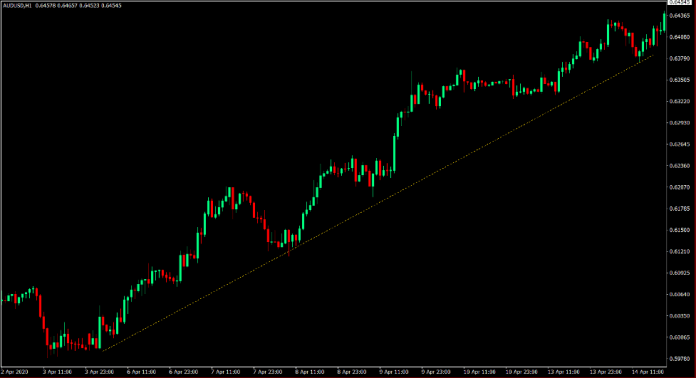
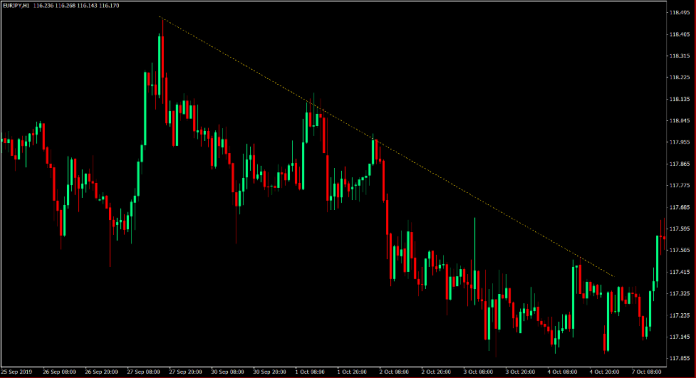
One of the most popular ways to identify a support or resistance is by identifying a trendline.
A trendline is basically a line which is connected by two or more swing points. Connecting two swing lows would form a support line, while connecting two swing highs would form a resistance line.
However, trendlines with just two swing points connected are not yet confirmed support or resistance levels. A support line is confirmed once a third swing point bounces up as it touches this level, while a resistance line is confirmed once a third swing point bounces down as it touches it.
Trendlines are great support and resistance levels. Some new traders may find it easy to identify a support or resistance level based on a trendline. However, traders often identify support and resistance levels correctly only after the fact. It is easy to identify trendlines correctly on a historical chart compared to a live chart while looking at the far-right corner of the chart where price candles are still forming. This is because identifying diagonal trendlines is very subjective. Traders may disagree with regards to angle of the trendline by a little bit, yet it would greatly affect where they would be expecting a reversal.
Swing Points as Horizontal Support and Resistance Levels
The Horizontal Support or Resistance is another type of support and resistance which is plotted horizontally as opposed to the diagonal support or resistance plotted using trendlines.
Horizontal Support and Resistance is based on market swing highs and swing lows, which if you would come to think of it, is a very logical support and resistance level. This is because such swing highs and swing lows were formed because the market saw it to be an extreme price level, thus causing the slight reversal.
Not all swing highs are resistance levels and not all swing lows are support levels. So, how do we identify such support and resistance levels properly. One option would be to identify support and resistance levels where price already bounced off. This means that we could plot a horizontal line which would connect two swing lows forming a support level or two swing highs forming a resistance level.
Another option would be to anticipate bounces off these levels using an entry signal which signifies a probable reversal on the short-term. This could either be a reliable momentum technical indicator or a candlestick pattern which indicates a probable reversal.
Zigzag Indicator as a Tool to Identify Swing Points
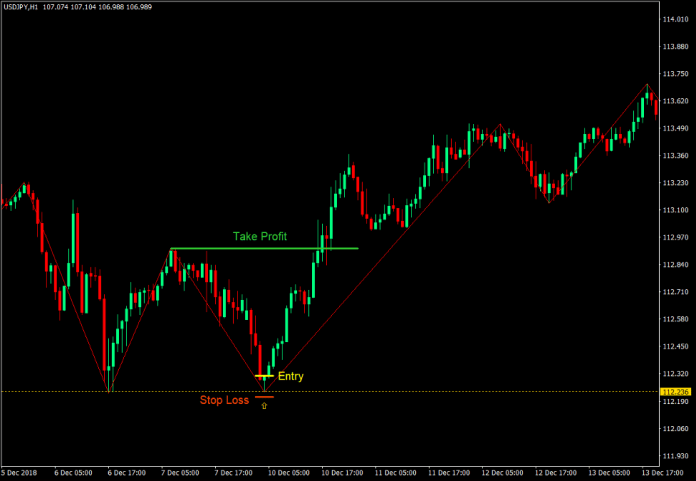
The Zigzag indicator is an excellent tool for identifying swing highs and swing lows. This is because the Zigzag indicator identifies such swing points automatically. It then connects the swing highs and swing lows with each other forming a zigzag like pattern.
Using this tool allows traders to objectively identify swing highs and swing lows without second guessing themselves.
Traders may then use these swing highs and swing lows identified by the Zigzag indicator as a level where they can wait and observe for a possible reversal signal.
Horizontal Support Bullish Reversal
- Use the most recent swing low identified by the Zigzag indicator as a possible support level.
- Wait for a bullish reversal candlestick pattern.
- Enter a buy order as soon as a bullish candlestick pattern form.
- Set the take profit target at a swing high identified by the Zigzag indicator.
- Set the stop loss below the entry candle.
Horizontal Resistance Bearish Reversal
- Use the most recent swing high identified by the Zigzag indicator as a possible resistance level.
- Wait for a bearish reversal candlestick pattern.
- Enter a sell order as soon as a bearish candlestick pattern form.
- Set the take profit target at a swing low identified by the Zigzag indicator.
- Set the stop loss above the entry candle.
Conclusion
Swing highs and swing lows are viable support and resistance levels. In fact, these are the same levels that market flow and supply and demand traders look at. Market flow traders identify these levels as support and resistance, while supply and demand traders may look at these areas as supply and demand areas. Either way, these are the levels that many successful traders look at when trading the market.
MT4 Indicators – Download Instructions
How to Trade Horizontal Support and Resistance Reversals is a Metatrader 4 (MT4) indicator and the essence of this technical indicator is to transform the accumulated history data.
How to Trade Horizontal Support and Resistance Reversals provides for an opportunity to detect various peculiarities and patterns in price dynamics which are invisible to the naked eye.
Based on this information, traders can assume further price movement and adjust their strategy accordingly. Click here for MT4 Strategies
Recommended Forex MetaTrader 4 Trading Platform
- Free $50 To Start Trading Instantly! (Withdrawable Profit)
- Deposit Bonus up to $5,000
- Unlimited Loyalty Program
- Award Winning Forex Broker
- Additional Exclusive Bonuses Throughout The Year
>> Claim Your $50 Bonus Here <<
Click Here for Step-By-Step XM Broker Account Opening Guide
How to install How to Trade Horizontal Support and Resistance Reversals.mq4?
- Download How to Trade Horizontal Support and Resistance Reversals.mq4
- Copy How to Trade Horizontal Support and Resistance Reversals.mq4 to your Metatrader Directory / experts / indicators /
- Start or restart your Metatrader 4 Client
- Select Chart and Timeframe where you want to test your MT4 indicators
- Search “Custom Indicators” in your Navigator mostly left in your Metatrader 4 Client
- Right click on How to Trade Horizontal Support and Resistance Reversals.mq4
- Attach to a chart
- Modify settings or press ok
- Indicator How to Trade Horizontal Support and Resistance Reversals.mq4 is available on your Chart
How to remove How to Trade Horizontal Support and Resistance Reversals.mq4 from your Metatrader Chart?
- Select the Chart where is the Indicator running in your Metatrader 4 Client
- Right click into the Chart
- “Indicators list”
- Select the Indicator and delete
How to Trade Horizontal Support and Resistance Reversals (Free Download)
Click here below to download:


