Many new traders make the mistake of equating a complex trading strategy with being a better trading strategy. While there are complex trading strategies that are also good, it does not necessarily follow that complex strategies are always better. In fact, in many instances it only causes more confusion and stress to a trader with little improvement with regards to trading accuracy and bottom line profits. In this regard, sometimes keeping it simple is better.
With that said, we will now be looking at two simple concepts in trading in which when combined together can produce great results. First, we will discuss flags and pennants, which are two of the simplest types of price patterns which are also very effective. Second is the Exponential Moving Average, which is one of the most basic technical indicators that many traders use.
Flags and Pennants
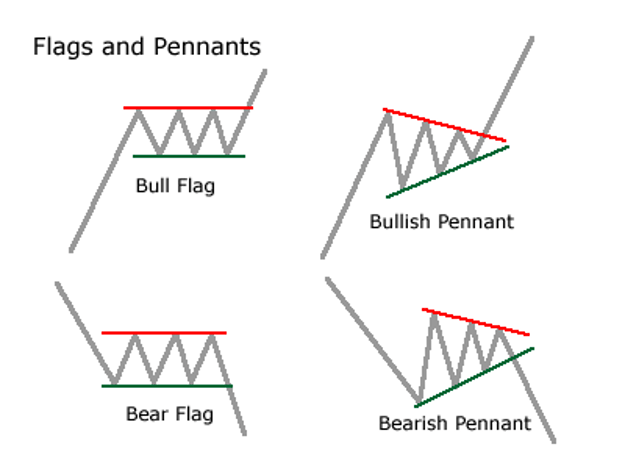
Flags and Pennants are trend continuation price patterns which are very effective. Because of this, many seasoned technical analysis traders who trade price patterns tend to favor trading with flags and pennants.
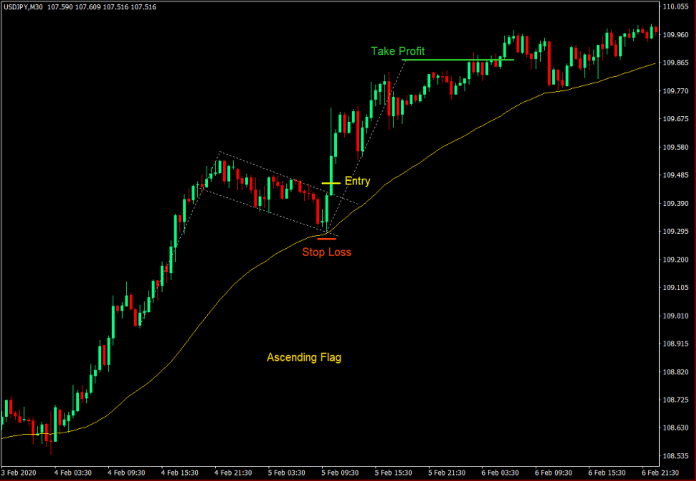
The Flag Pattern is characterized by a long initial momentum thrust followed by a tight ranging with a parallel support and resistance on the range. The initial momentum thrust forms the pole of the flag, while the parallel range on the consolidation phase forms the body of the flag. Price typically breaks out in the direction of the trend and continues for another momentum push.
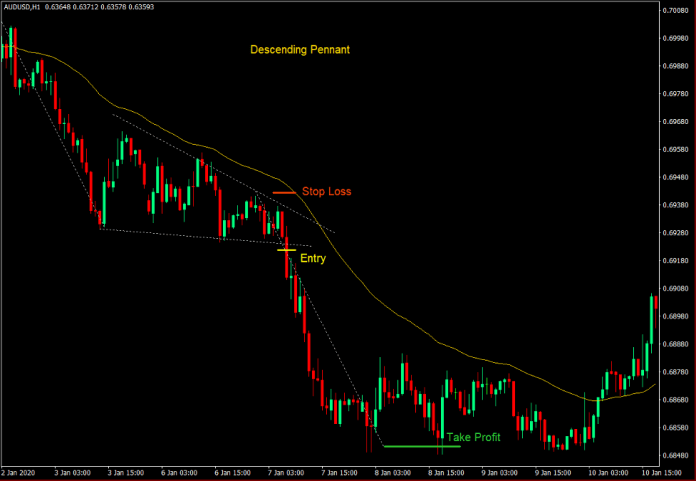
The Pennant on the other hand is somewhat similar to the Flag Pattern with some slight differences. Instead of having a parallel support and resistance on the body or the consolidation phase, which is characteristic of the Flag Pattern, the Pennant is characterized by a tightening consolidation phase forming a triangle on its body. Still, the same characteristic breakout in the direction of the prior trend is also commonly seen after a pennant pattern.
If you would look at these patterns closely, these patterns tell us a story of price pushing strongly in a certain direction with strong momentum, which is what forms the pole of the flag or pennant pattern. However, as it reaches its peak, the market starts to consolidate. This might be due to traders who made money on the initial thrust starting to close their positions in profit thinking that the market is not going to push further. However, there are still many traders who believe that the market would still push in the same direction. So, price would still hold on the consolidation phase. Then, as the market starts to gain momentum, price would breakout in the direction of the trend. This creates the second phase of the trend.
The pennant on the other hand has a contraction phase that is tightening. This means that the volume of trades is starting to decrease. This might be due to traders staying on the sidelines and not making a trade because they would want to see a clear direction. Still, price would typically breakout in the direction of the trend as traders would jump back in on the first hint of a breakout.
So, how do traders usually trade these patterns?
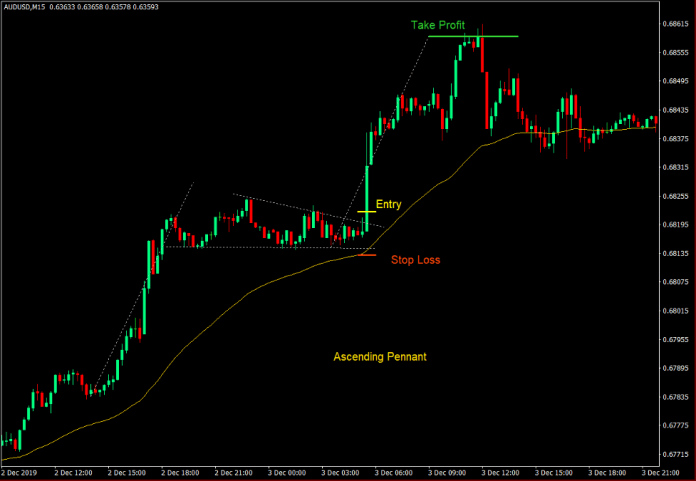
Traders typically wait for the breakout and place their stop losses on the opposite end of the range or the tightening market contraction. The advantage of the flag pattern is that it has more room for price to move since the stop loss would be a bit further. On the other hand, pennants could also be good because the contracting pattern allows for a tighter stop loss allowing for higher risk-reward ratios.
50-Period Exponential Moving Average
Moving Averages are a staple among many technical analysis traders.
It is a simple indicator which allows traders to identify trend direction. Traders typically identify trend direction based on the typical location of price action in relation to the moving average line, as well as the slope of the line.
Many traders also identify trend reversals based on the crossing over of two moving average lines or of price and a moving average line.
The 50-period Exponential Moving Average (EMA) line is one of the most popular moving average lines. Many traders use it as a basis for a mid-term trend. In fact, many seasoned traders would avoid trading against it as trades typically have higher win probabilities whenever it is in the direction of the 50 EMA trend.
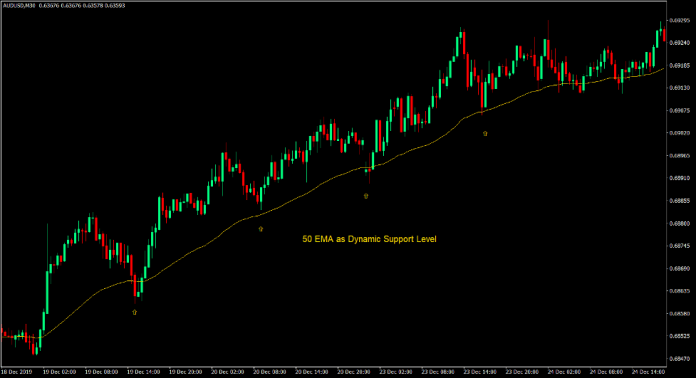
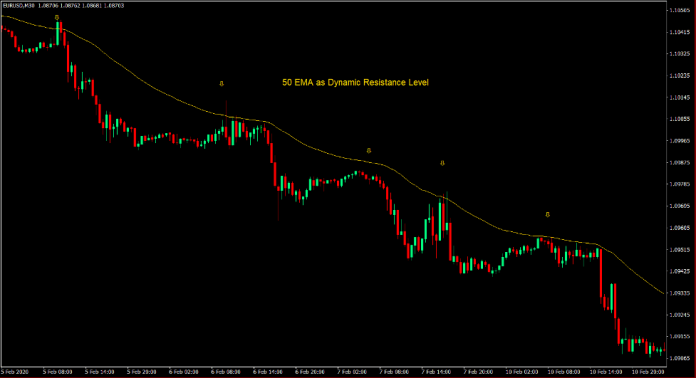
The 50 EMA also works well as a dynamic support or resistance level. During an established trend, price would typically bounce off this level after every retracement as the market sees it as a support or resistance level. It is probably because many traders see it as a discount when trading in the direction of a trend whenever price retraces back to its mean.
Given this characteristic of the 50 EMA line, the 50 EMA is an excellent level to anticipate bounces after a market contraction phase. As said earlier, the Flag and Pennant Patterns are market contraction phases after an initial trend thrust. This makes the 50 EMA line a good location to start observing for potential breakouts from a flag or pennant pattern.
Ascending Flag or Pennant Setup
- The 50 EMA should slope up.
- Price action should be above the 50 EMA line.
- A bullish momentum move should be observed forming the pole.
- Wait for price action to consolidate or contract towards the 50 EMA line forming the body of the flag or pennant pattern.
- Enter a buy order as price breaks above the resistance of the market consolidation phase.
- Set the stop loss below the support of the market consolidation phase.
- Option 1: Set the take profit target at roughly the same length as the pole coming from the breakout or a little shorter.
- Option 2: Keep the trade open until the momentum from the bullish breakout diminishes.
Descending Flag or Pennant Setup
- The 50 EMA should slope down.
- Price action should be below the 50 EMA line.
- A bearish momentum move should be observed forming the pole.
- Wait for price action to consolidate or contract towards the 50 EMA line forming the body of the flag or pennant pattern.
- Enter a sell order as price breaks below the support of the market consolidation phase.
- Set the stop loss above the resistance of the market consolidation phase.
- Option 1: Set the take profit target at roughly the same length as the pole coming from the breakout or a little shorter.
- Option 2: Keep the trade open until the momentum from the bearish breakout diminishes.
Conclusion
The flag and pennant pattern are two of the most reliable trading patterns. This is primarily because these patterns are trend continuation patters so we are not trading against the trend.
However, many new traders find it difficult to spot these patterns correctly.
The 50 EMA line simplifies finding these patterns by giving traders an area where these patterns typically form.
Traders who can master identifying these patterns through the use of the 50 EMA, as well as identify the correct breakouts can make money trading these patterns as these patterns recur again and again in the market.
MT4 Indicators – Download Instructions
How to Trade Flags and Pennants Using Moving Average Lines is a Metatrader 4 (MT4) indicator and the essence of this technical indicator is to transform the accumulated history data.
How to Trade Flags and Pennants Using Moving Average Lines provides for an opportunity to detect various peculiarities and patterns in price dynamics which are invisible to the naked eye.
Based on this information, traders can assume further price movement and adjust their strategy accordingly. Click here for MT4 Strategies
Recommended Forex MetaTrader 4 Trading Platform
- Free $50 To Start Trading Instantly! (Withdrawable Profit)
- Deposit Bonus up to $5,000
- Unlimited Loyalty Program
- Award Winning Forex Broker
- Additional Exclusive Bonuses Throughout The Year
>> Claim Your $50 Bonus Here <<
Click Here for Step-By-Step XM Broker Account Opening Guide
How to install How to Trade Flags and Pennants Using Moving Average Lines.mq4?
- Download How to Trade Flags and Pennants Using Moving Average Lines.mq4
- Copy How to Trade Flags and Pennants Using Moving Average Lines.mq4 to your Metatrader Directory / experts / indicators /
- Start or restart your Metatrader 4 Client
- Select Chart and Timeframe where you want to test your MT4 indicators
- Search “Custom Indicators” in your Navigator mostly left in your Metatrader 4 Client
- Right click on How to Trade Flags and Pennants Using Moving Average Lines.mq4
- Attach to a chart
- Modify settings or press ok
- Indicator How to Trade Flags and Pennants Using Moving Average Lines.mq4 is available on your Chart
How to remove How to Trade Flags and Pennants Using Moving Average Lines.mq4 from your Metatrader Chart?
- Select the Chart where is the Indicator running in your Metatrader 4 Client
- Right click into the Chart
- “Indicators list”
- Select the Indicator and delete
How to Trade Flags and Pennants Using Moving Average Lines (Free Download)
Click here below to download:

